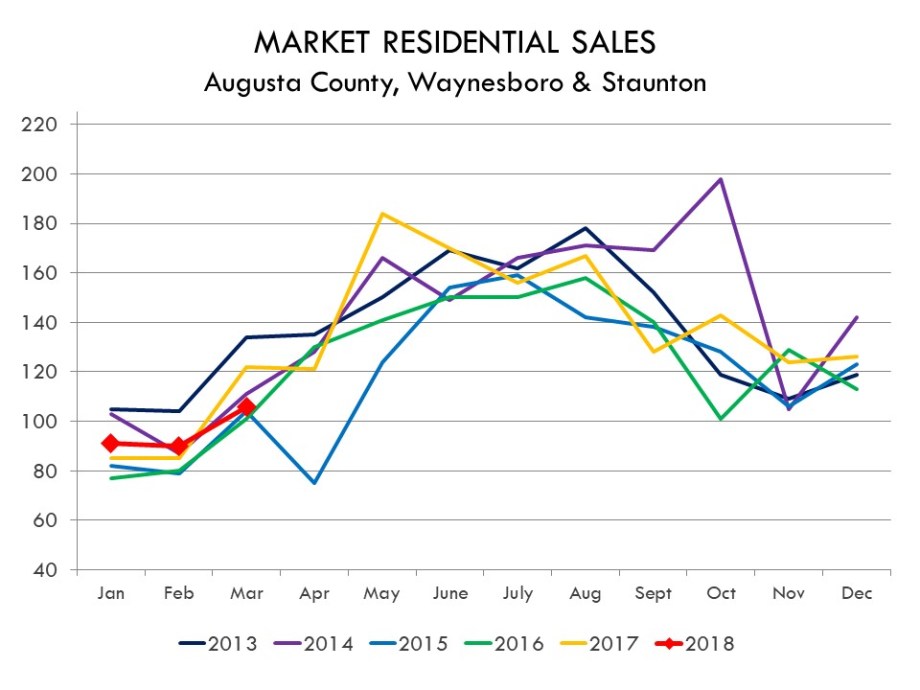
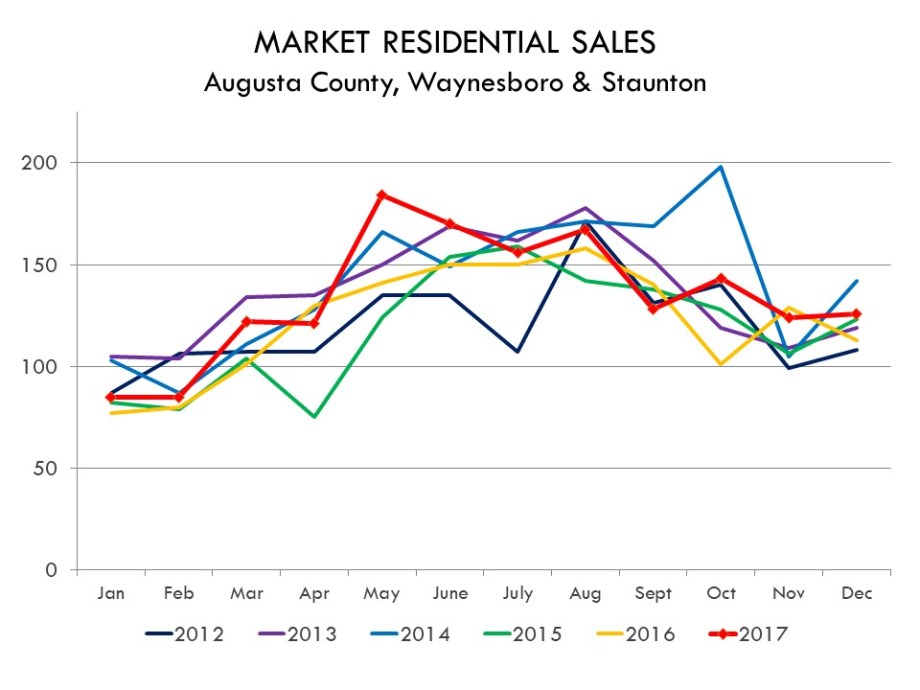
RESIDENTIAL SALES: MONTH -TO- MONTH
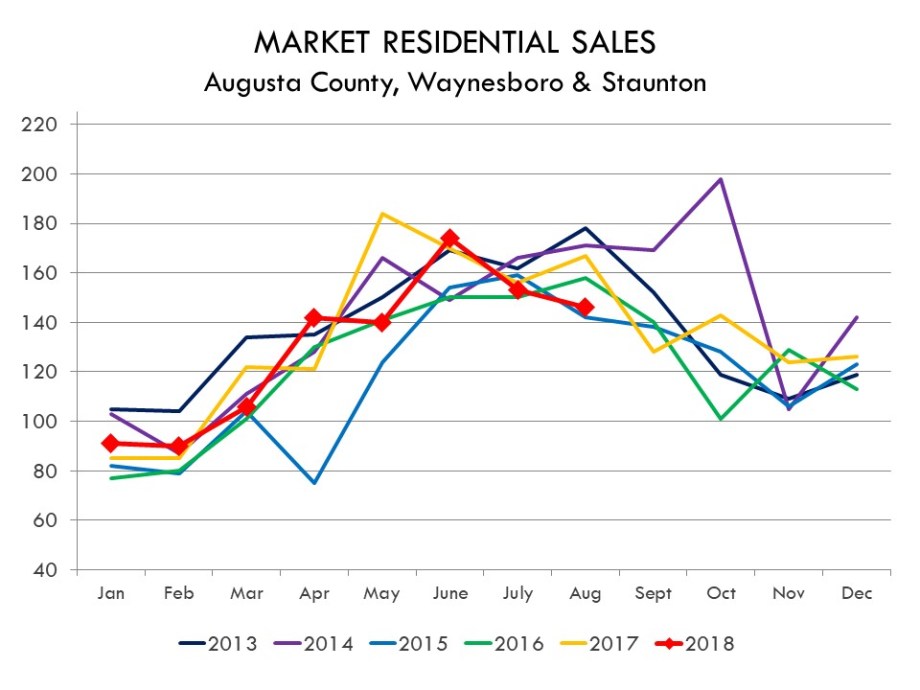
The number of sales hit an all-time high in 2005, with a total of 1598 closed transactions and a low in 2010, with 935. The market has gradually improved since then…
- 2013 = 1220 sales
- 2014 = 1383 sales
- 2015 = 1489 sales
- 2016 = 1511 sales
- 2017 = 1581 sales
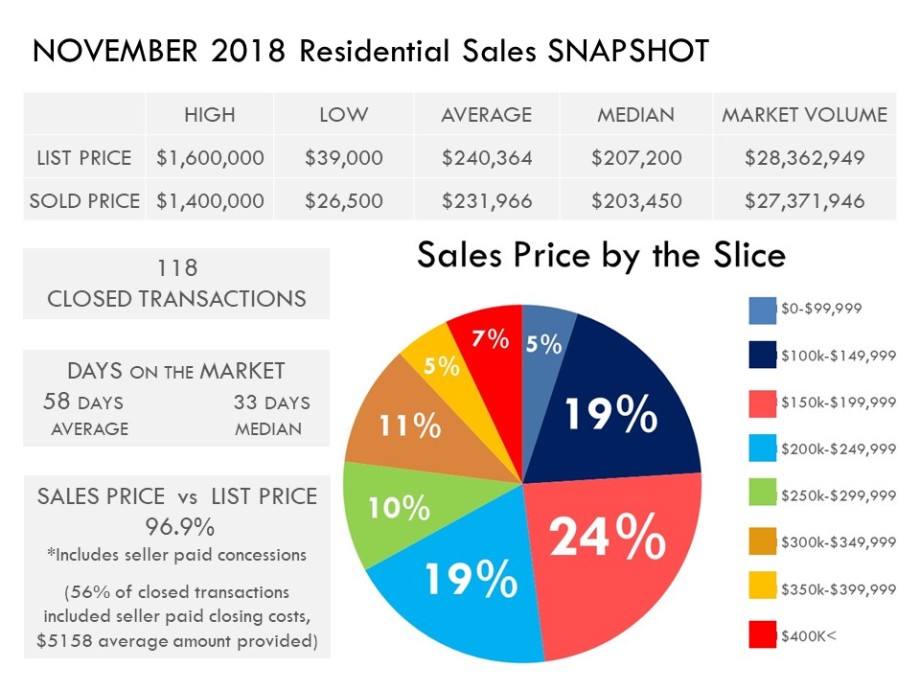
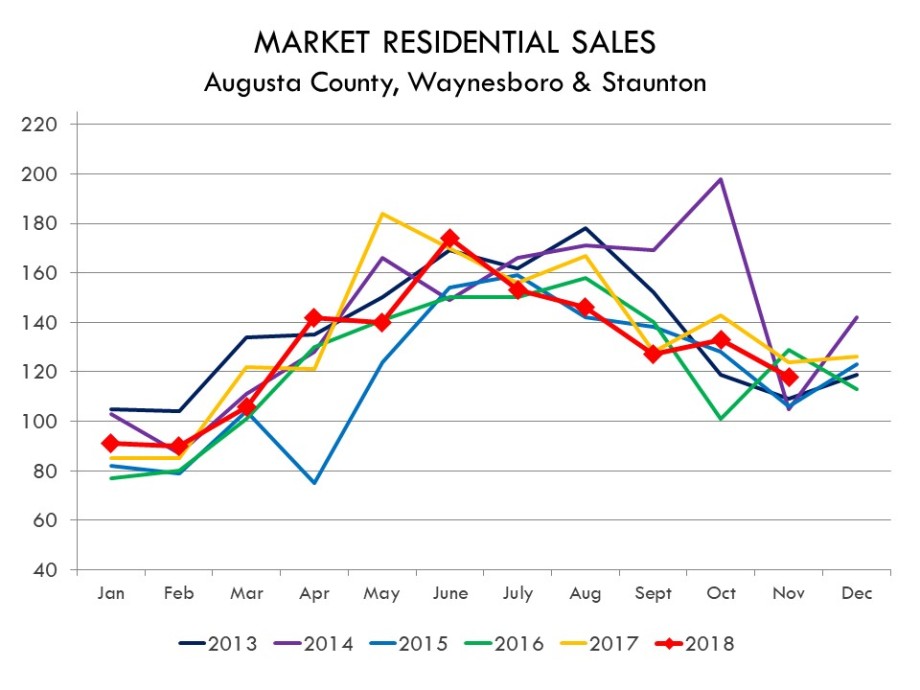
November 2018 monthly sales (118) was an expected 11% DECREASE when compared to last month, October (133). (2017 had a similar 10% decrease from Oct-Nov.); Nov 2018 sales (118) was a 5% DECREASE from last year’s November sales (124).
November’s 2018 Year-to-Date sales, (1465) displays a negligible 1% DECREASE under November 2017 YTD sales, (1487).
November’s 12 Month Running Total (1611) mimics the YTD, with less than 1% Decrease under Nov 2017’s 12 Mo. Running Total, (1620). (This is a better predictor of our current market.)
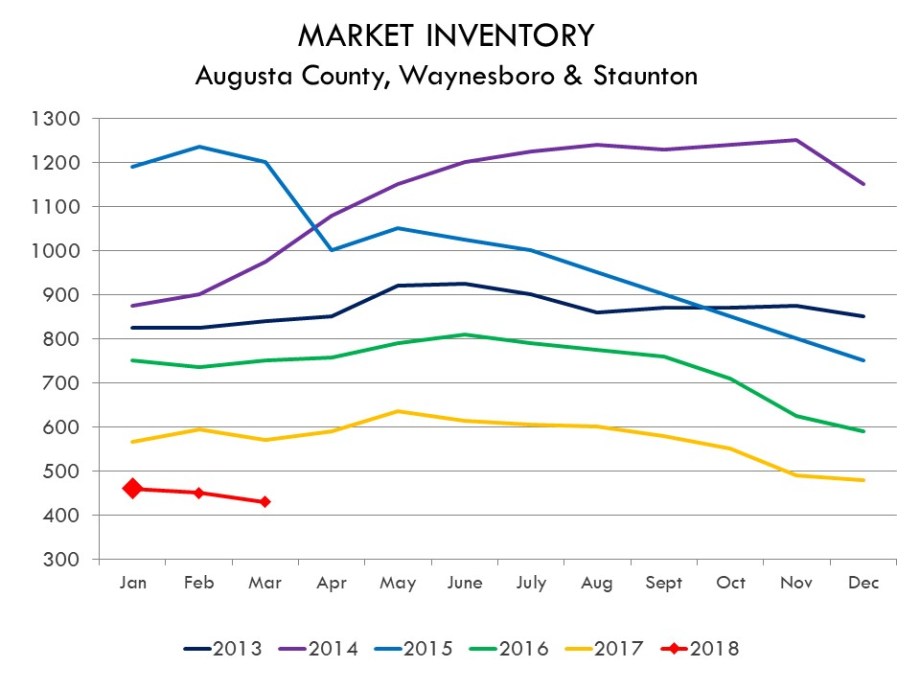
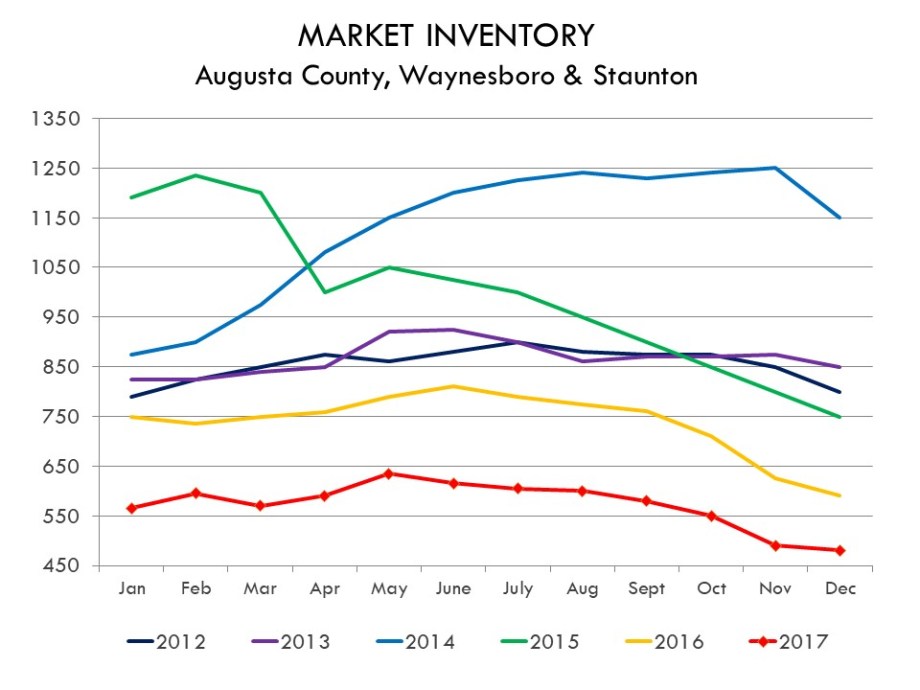
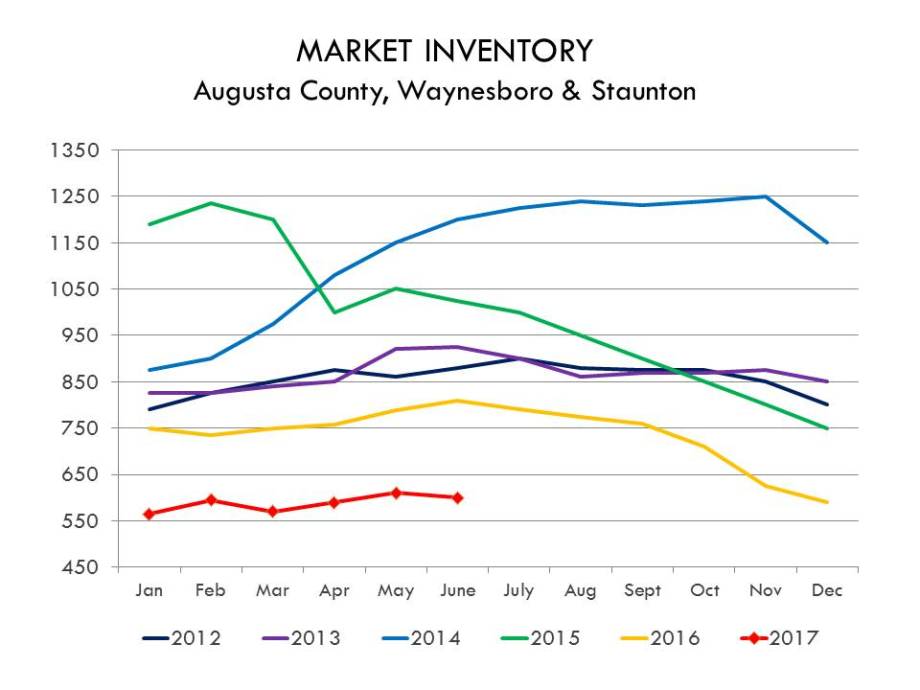
RESIDENTIAL INVENTORY: MONTH -TO- MONTH…and the lack of inventory saga continues.
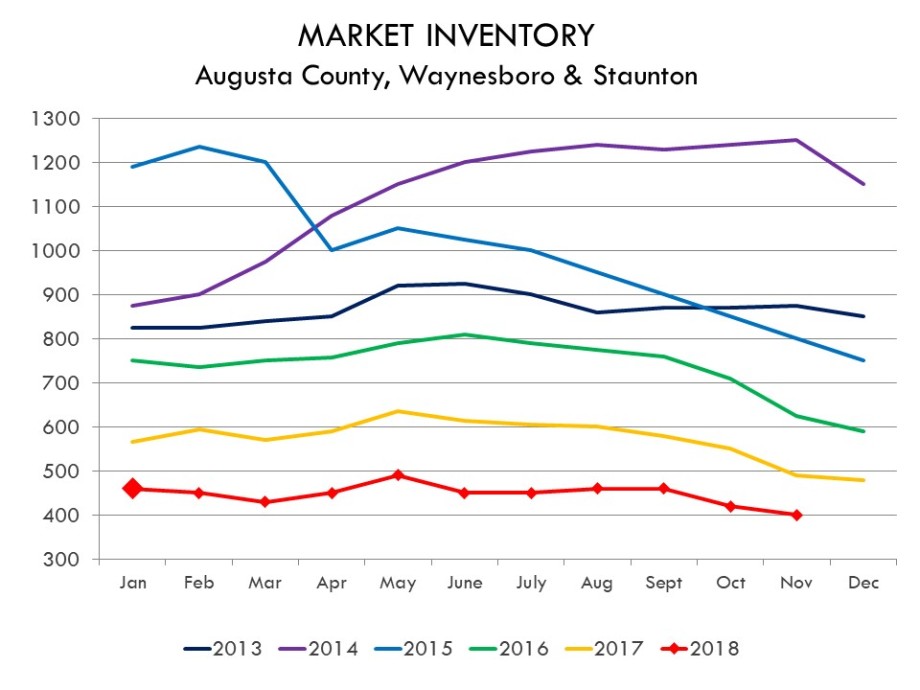
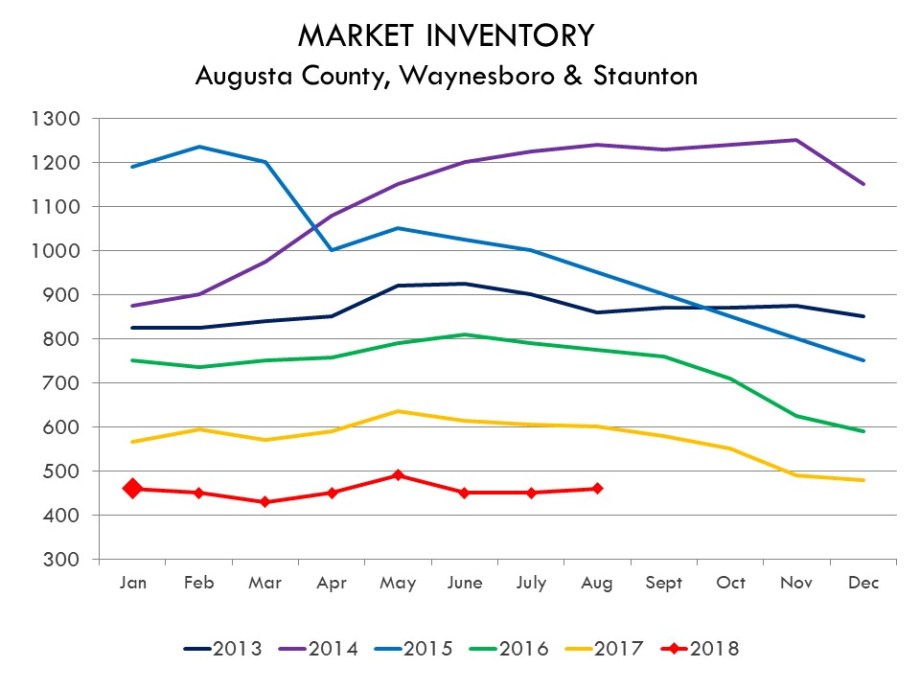
The number of active listings in Jan 2009 was 498, increased to a high of 1509 in Aug 2010. We started 2018 with 450 active listings, which was 20% LESS than Jan 2017. Historical lows in inventory began back in 2016, homebuyers and agents really started to feel its impact during the 3Q buying season. The end of 2016 deemd itself a “price-adjusting” year, cleaning out stale properties. 2017 followed a similar pattern with low inventory and price-adjusting. 2018’s inventory continues to be squeezed: Inventory opened up a tinie-tiny amount in May…but decreased again in June and was further depleted this Fall.
- November 2018’s inventory is 18% LESS than Nov 2017; 36% LESS than Nov 2016; 50% LESS than Nov 2015.

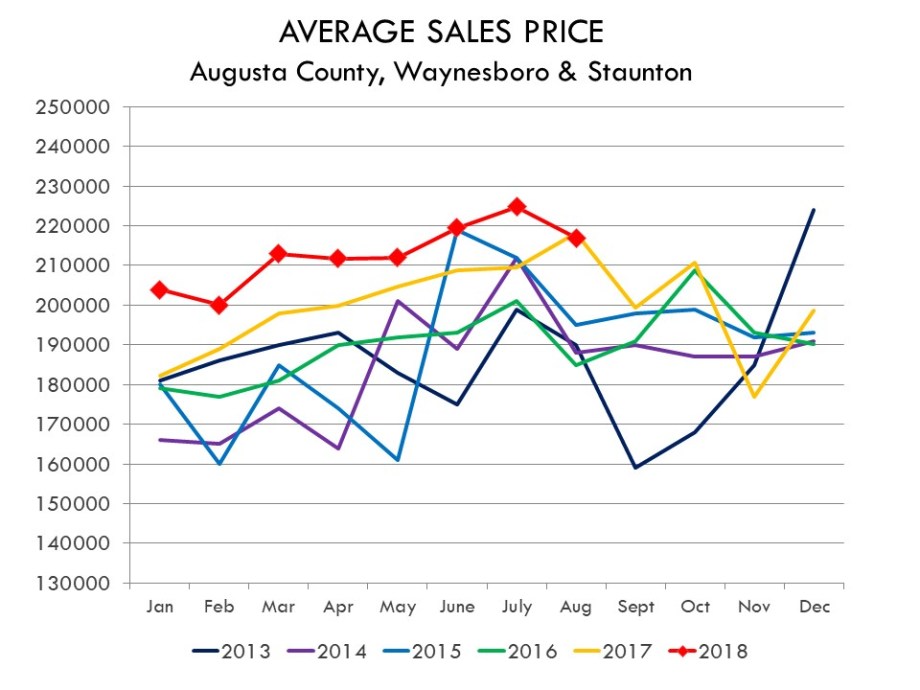
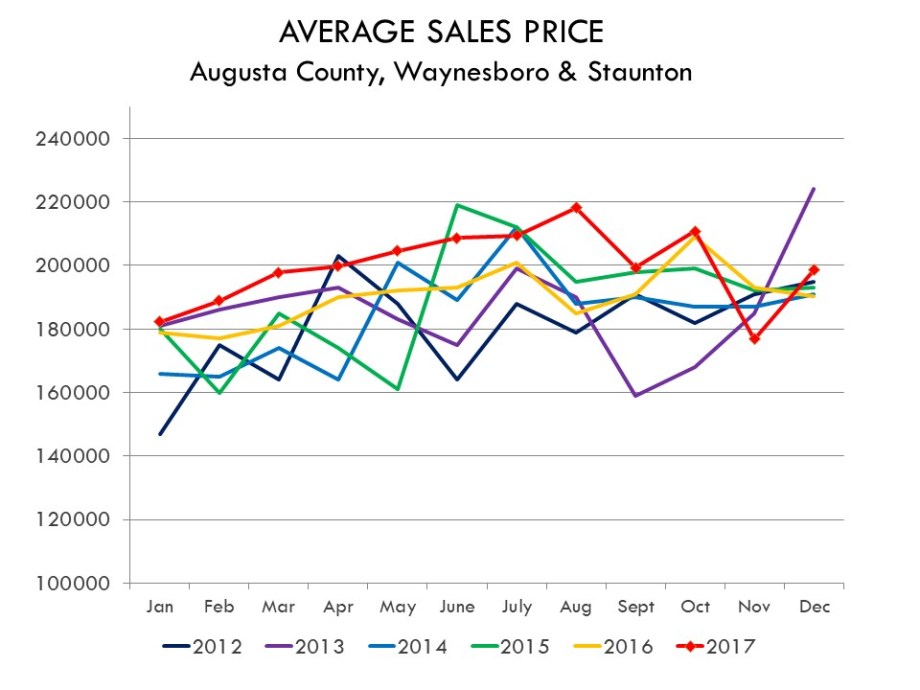
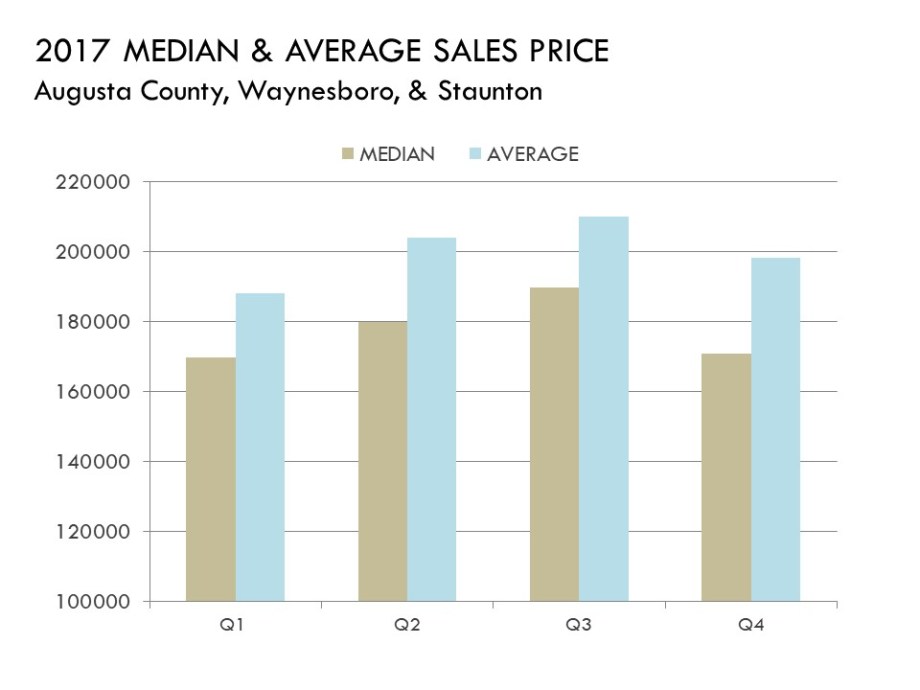
AVERAGE SALES PRICE: MONTH -TO- MONTH…
With low supply, comes high demand…reflected in the increasing Average Sales Prices. We noticed a solid 6% INCREASE over the course of 2017, most dramatic in properties within the $250k and under price segment. November 2018 Average Sales Price ($231,966) is a whopping 31% INCREASE over Nov 2017 ($176,868, the lowest of the year). Nov 2018 ASP is a 12% INCREASE from last month, Oct 2018 ($204,382). Each month in 2018 has experienced its highest ASP, year-over-year, for the last five years.
*[November did have one unusual over $1M sale, which obviously contributed, but even with that transaction taken out of the calculated average, the month still experienced a five year high of $221,982].
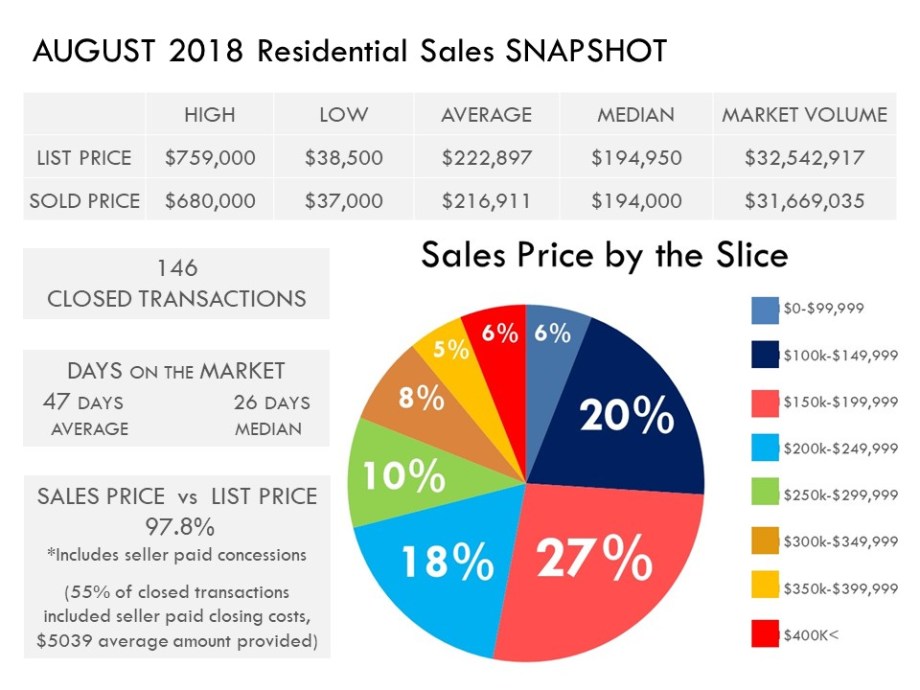
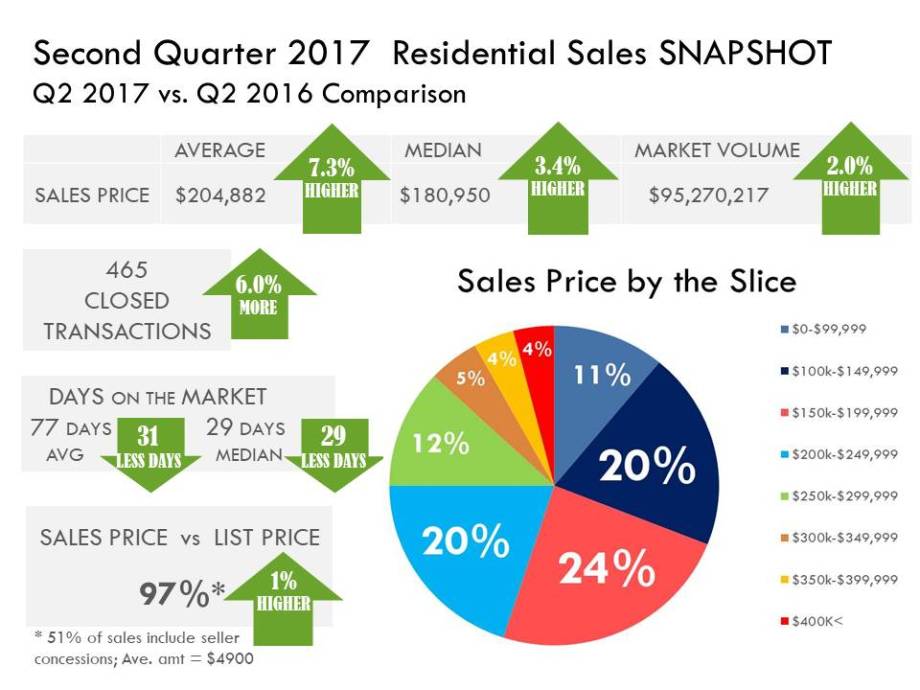
[Unfortunately, what is NOT factored into the average sales price, is the average amount of seller paid concessions. In November 2018, 56% of sales transactions included seller paid closing costs. Of those transactions with seller paid concession, average paid was $5158 at settlement.] 28% of the Buyer’s from August’s transactions financed with gov’t backed loans, (i.e. FHA, VA, VHDA, and USDA). These loans offer no-to-low down payment features; 46% obtained conventional financing’ 15% were all-cash transactions.
- Average Days on Market (DOM) for 2005 was 101 Days, and steadily increased to an all-time high of 177 days in April 2013.
- 2017’s DOM bumped around, but averaged out to an annual ave
 rage of 77 Days.
 - Nov 2018 Stats: Average: 58 DOM / Median 33 DOM
- % of November Sales Under Contract within…
- 36 % of monthly sales were pending within 15 Days
- 47 % of monthly sales were pending within 30 Days
- 71 % of monthly sales were pending within 60 Days
* FINAL THOUGHTS *
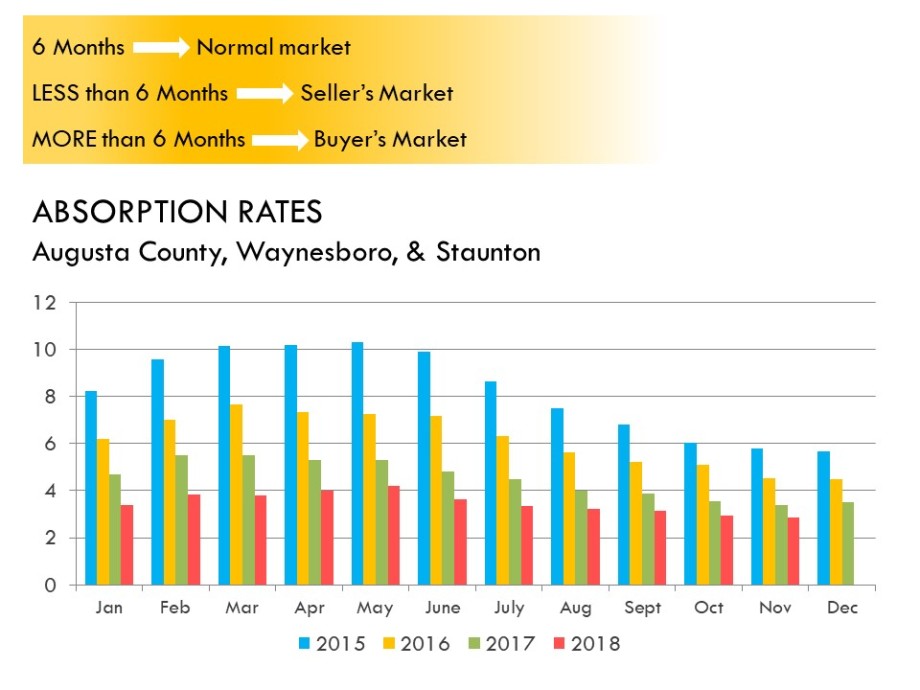
We are officially in the organic seasonal downshift of buying and selling real estate. With that said, this area is still experiencing much of a “seller’s market” supported by historically low inventory and equally historically high Average Sales Prices. Days on Market have continued to stay low, especially for those properties in the $250k and under price range.
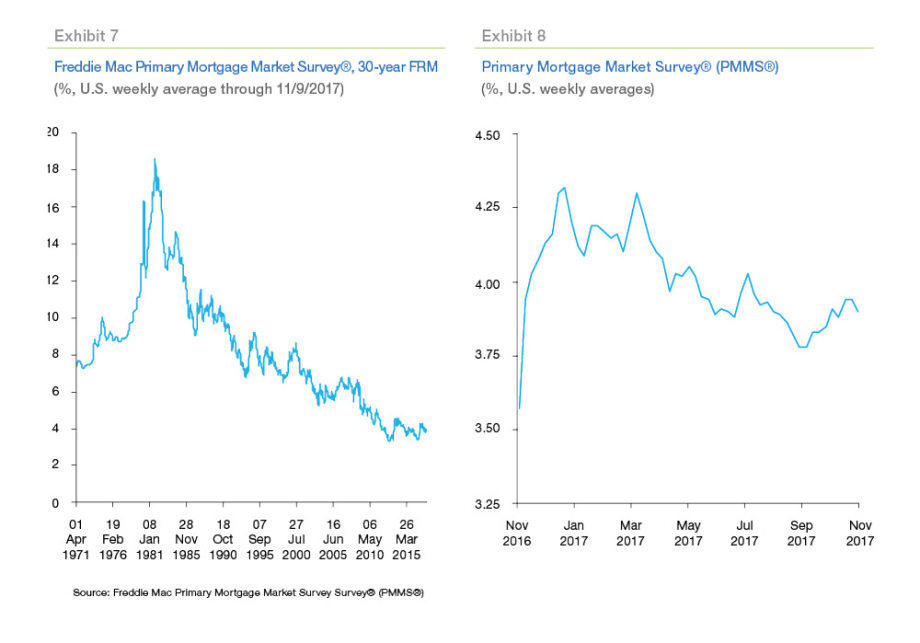
Interest rates have been creeping higher, and predicted to continue through-out the year. This will propose yet another hurdle for potential buyers. Higher interest rates could also affect homeowners thinking about selling their property. Many could decide to stay put, not willing to buy their next homesweethome at the cost of a higher rate…continuing this low supply saga.
- FOR SELLERS: Proper pricing & staging is key for a quick and smooth transaction. (Properties that are over-priced are idling on the MLS, while properly priced homes are continuing to move quickly. Revisit Days on Market Stats above.)
- FOR BUYERS: Interest rates have been creeping upwards, and predicted to increase through-out the year. Remain in contact with your chosen lender to stay current with affordability, and request a Pre-Approval Letter to submit with any offer to display financial stability and strength. Don’t be surprised if you find yourself in a multiple-offer situation, competing for your dream home. Its essential for buyers to discuss with their real estate agent competitive offer strategy. Contract contingencies that were the norm just a few years ago, may not fly in this “multi-offer” market. When offering over list price, appraisal contingencies are a must, as appraisers catch up with 2018’s upward movement.
Happy Holidays!
Katherine
* This report was prepared by and for the use of Katherine McNicholas, Westhills Ltd. REALTORS. It is not to be copied in whole or in part without explicit permission of author.*
* All data based on information from the Greater Augusta Association of REALTORS®, Inc. or Multiple Listing Service. All information is believed to be accurate, but cannot be guaranteed.
 Average Days on Market (DOM) for 2005 was 101 Days, and steadily increased to an all-time high of 177 days in April 2013.
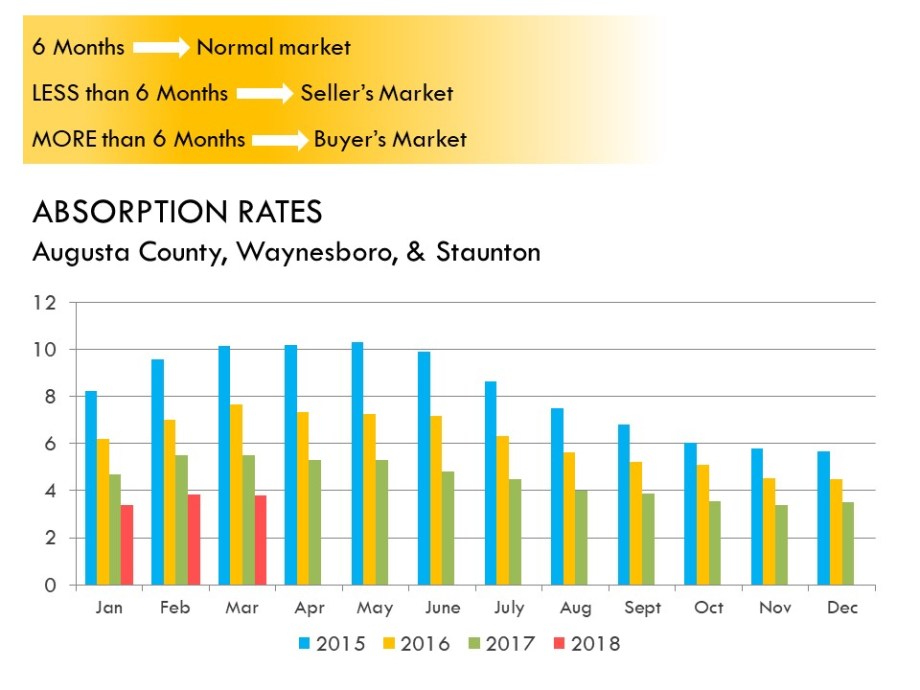

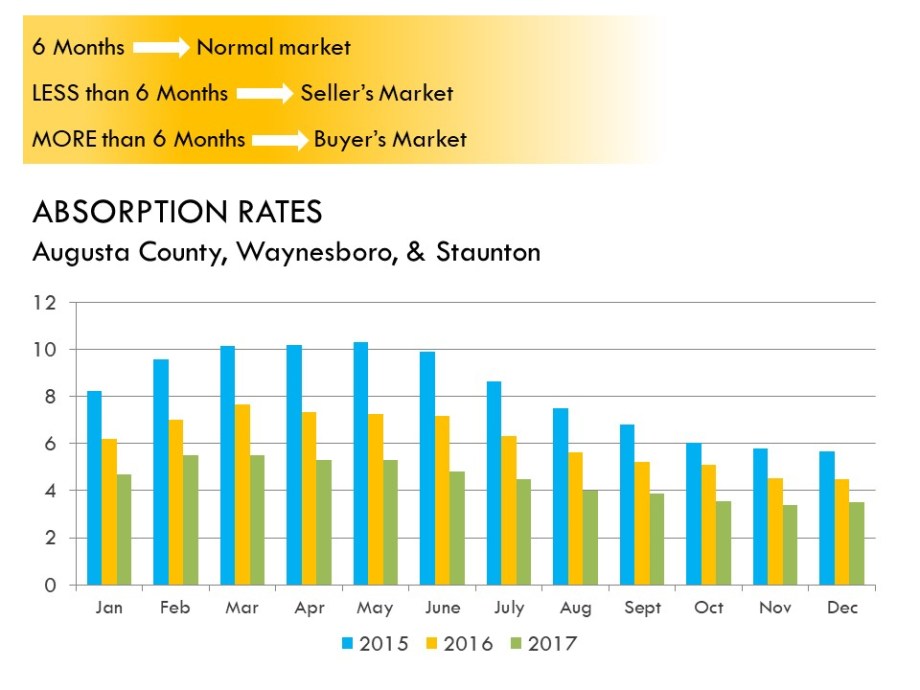


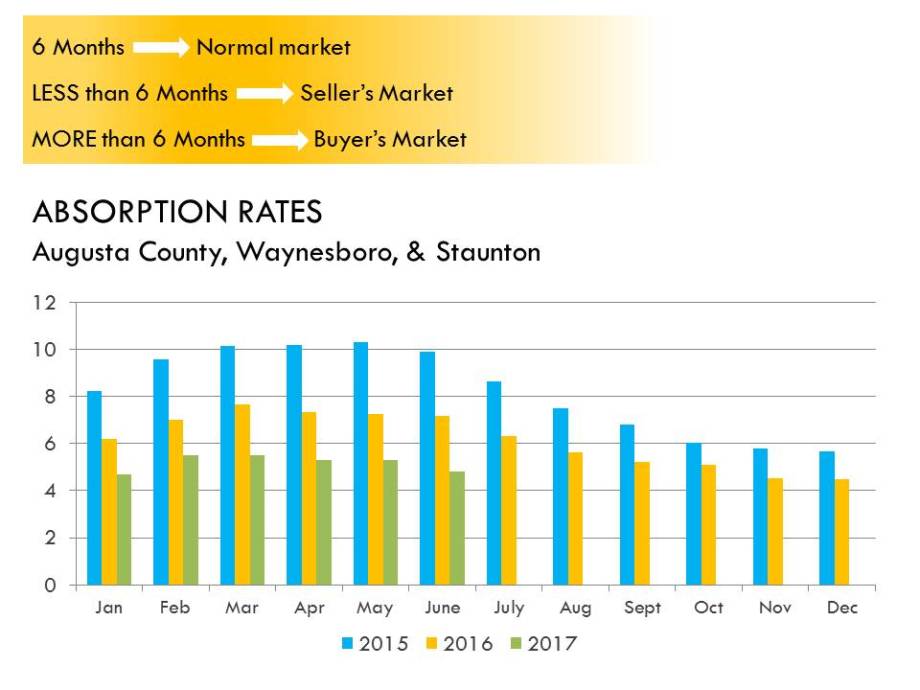
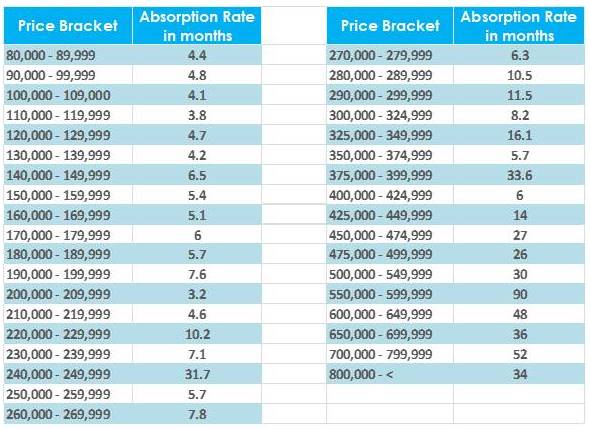


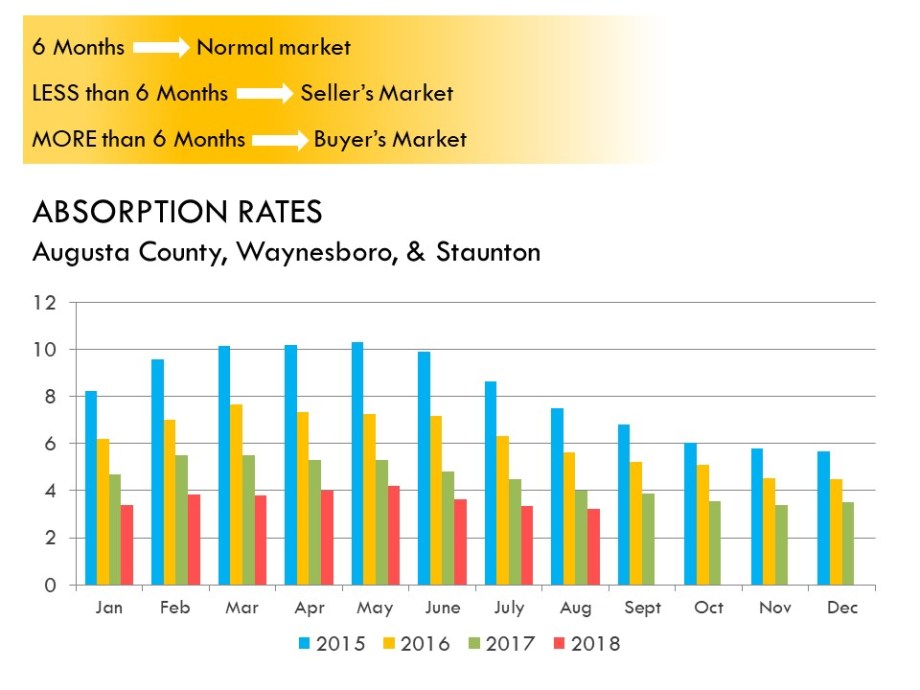
 This measurement tool can be focused to compare neighborhoods, price ranges, etc. and can totally vary depending on data set. For instance, if you were getting ready to put your own home on the market…the absorption rate for properties in your neighborhood & price range are both VERY IMPORTANT items to know. It will help both, you and your agent strategically price your home. As a buyer, (let’s say you were looking for a home last December.) Your preferred price range was $150k to $200k. The absorption rate for that price range was an average of 2.9 months…With that rate, you need to get your sweetlittletushy out to see the property ASAP. With that said, if your price range was $600k-$650k, the absorption rate in Dec. was 24 months, not quite as urgent. I think you get the jist of it…


 I N A N U T S H E L L . . .


